Post Volume Stats Widget
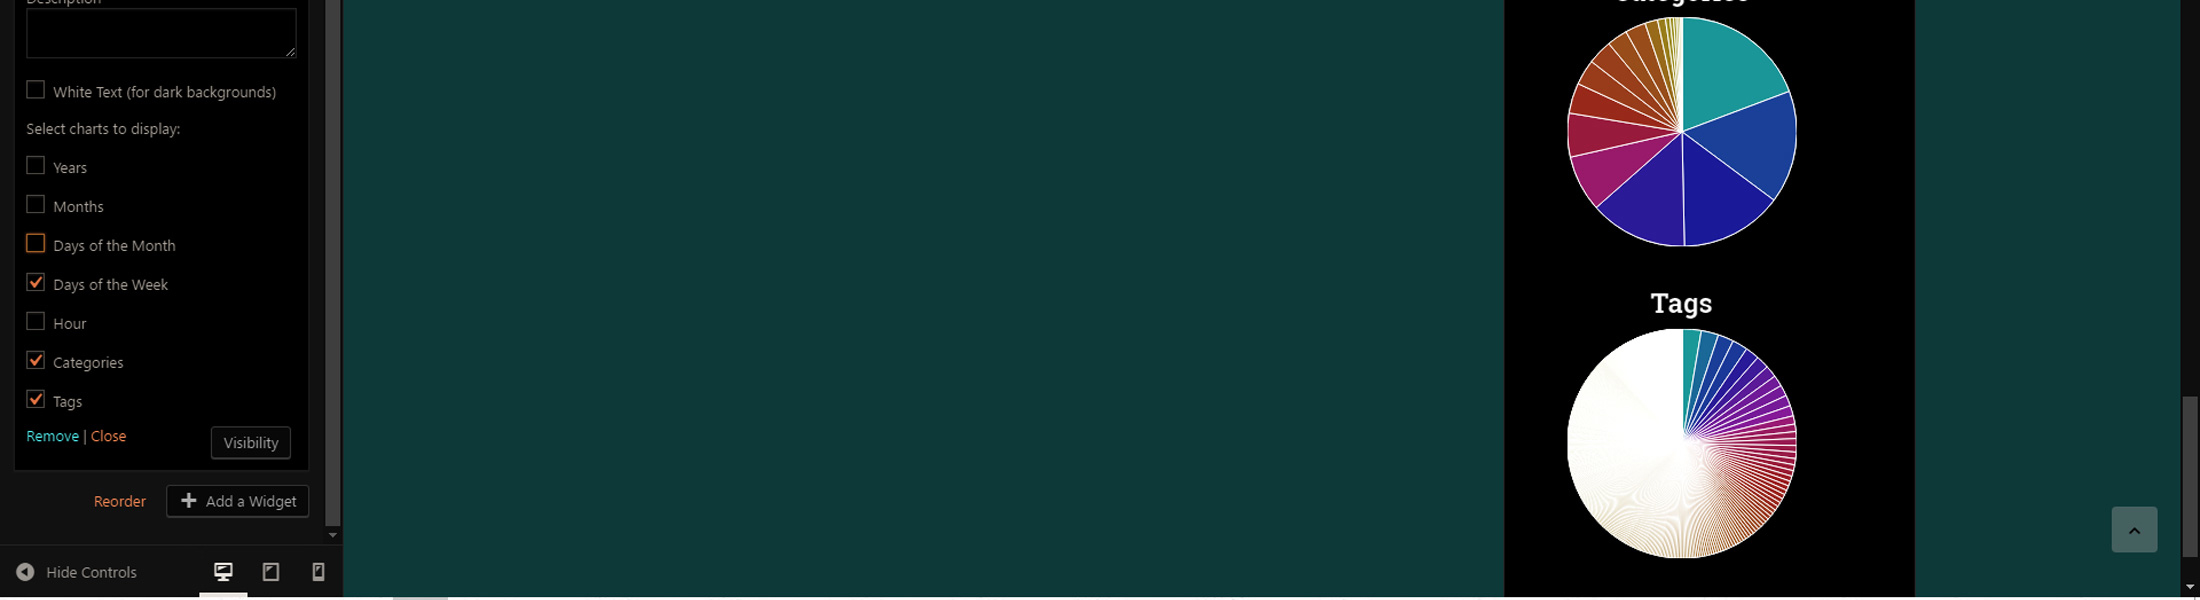
Show your post volume stats to your visitors with the easy-to-use Post Volume Stats widget.
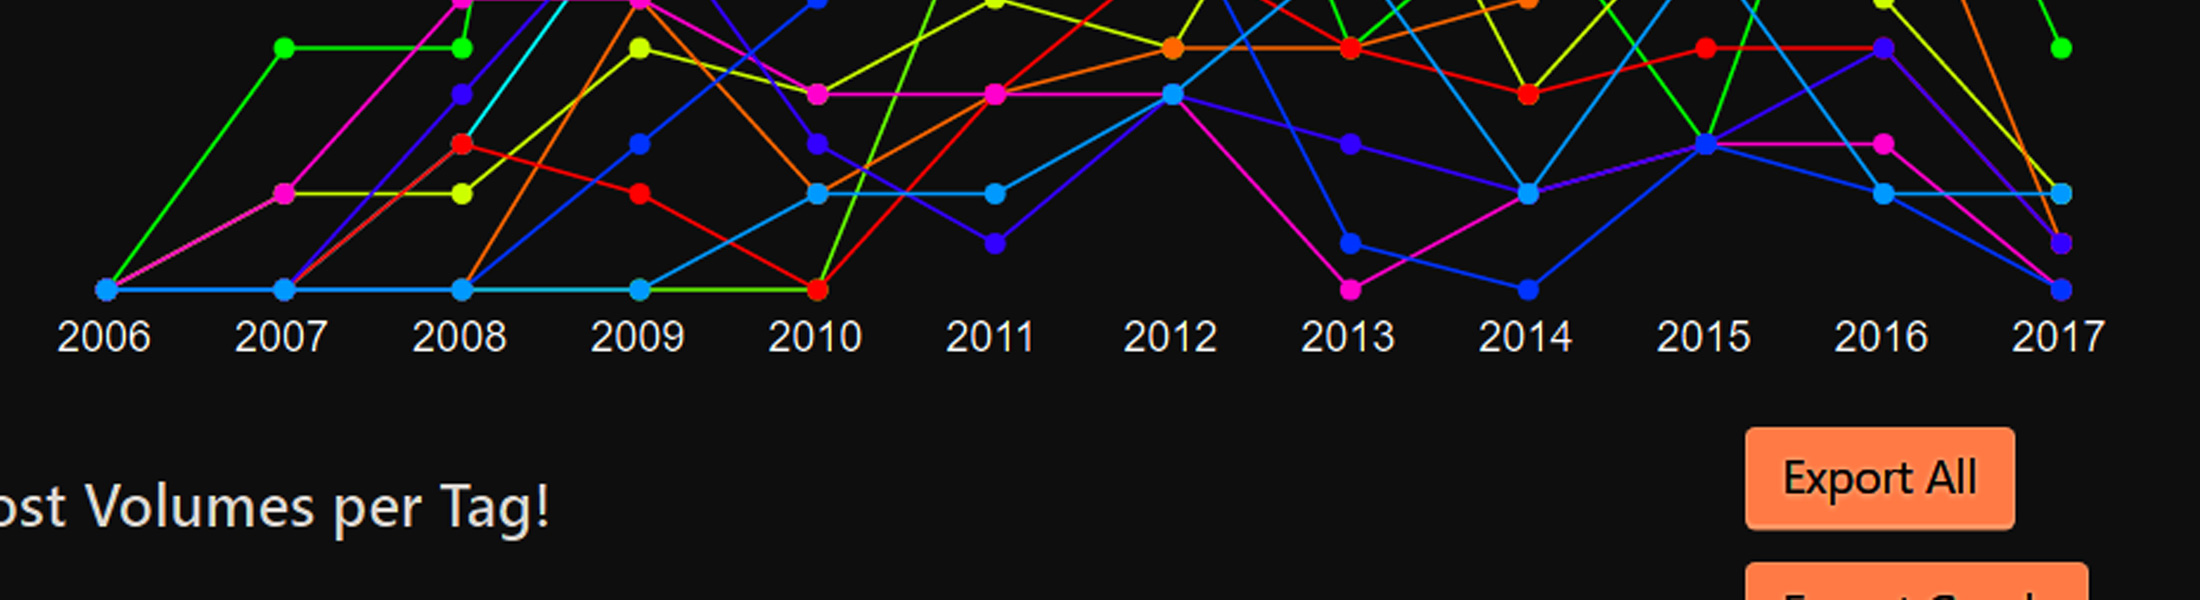
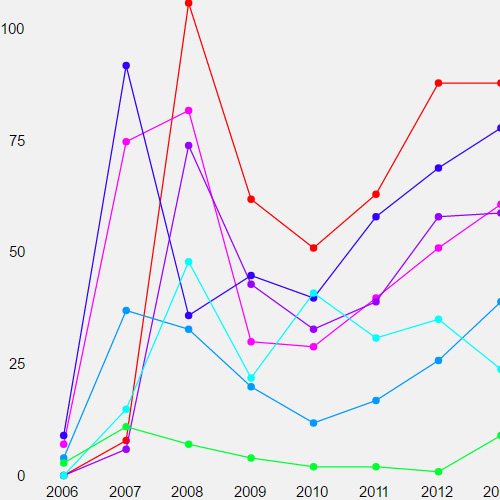
Post Volume Stats Line Graphs
You can choose some or all of your tags, categories and custom taxonomy to plot in a line graph to compare how they have changed in volume over the life of your blog. You can then export the line graph and/or list into a blog post, if you wish.
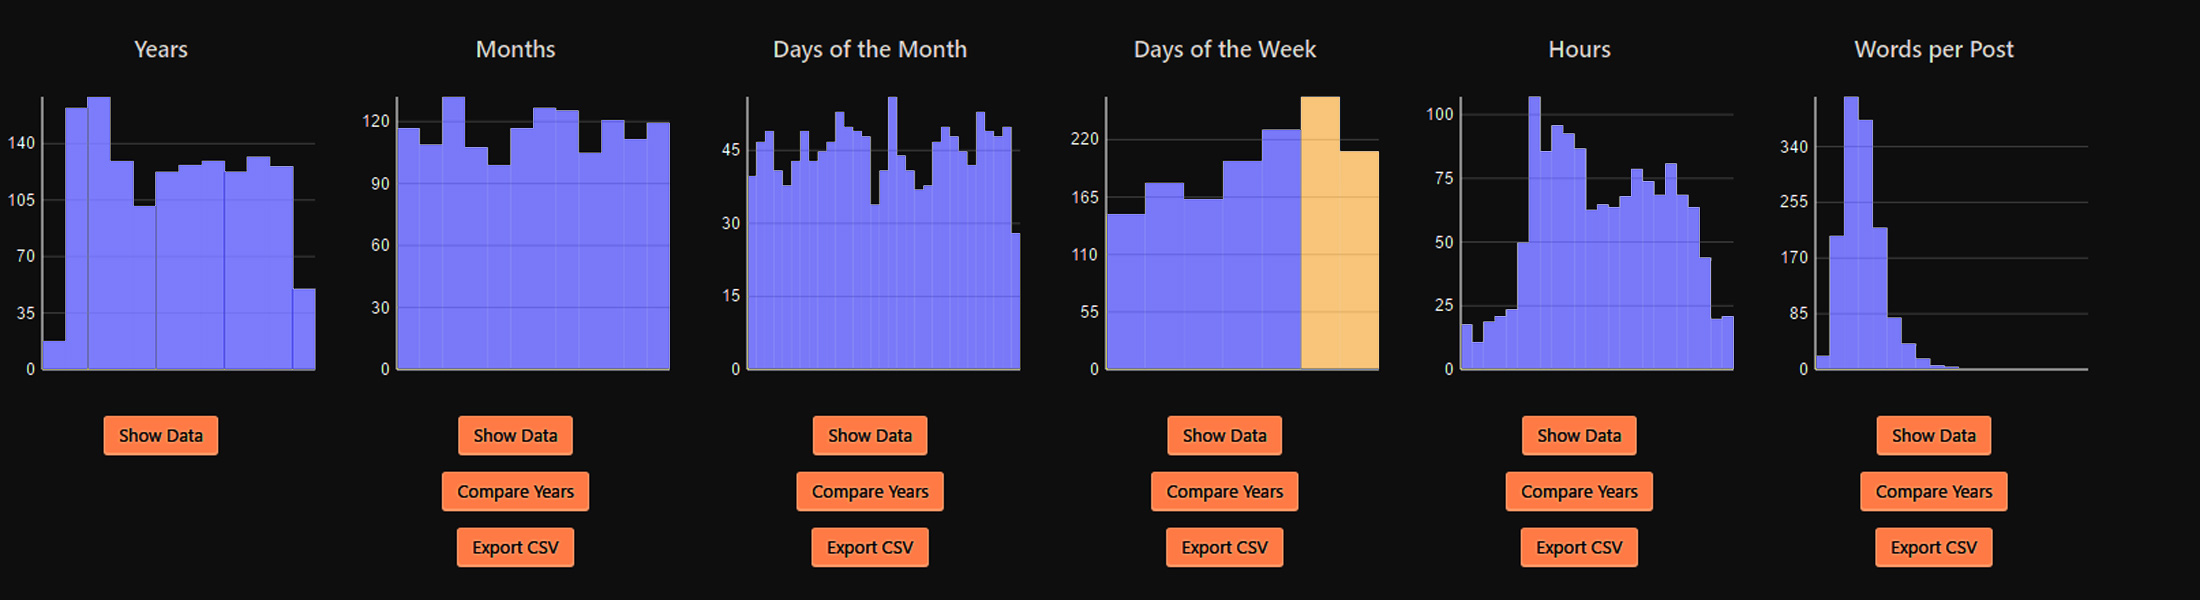
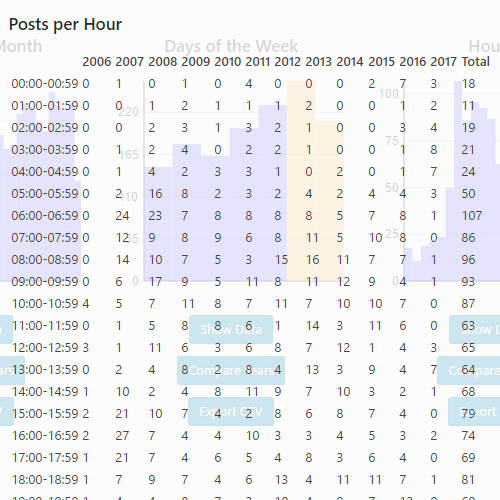
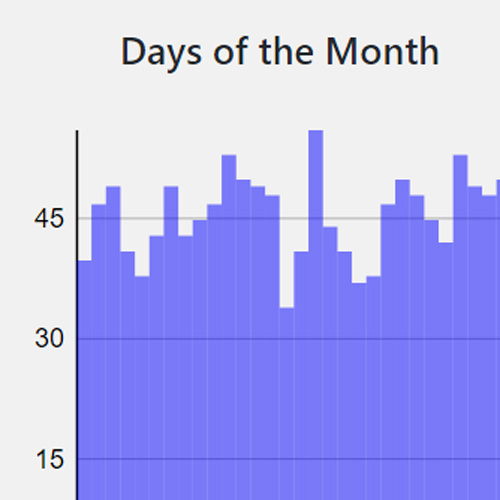
Post Volume Stats Bar Charts
On the main Post Volume Stats page you can compare how various stats have changed over the years and for different post authors. These graphs are able to be added to your WordPress blog's sidebar with the easy-to-use widget.